In technical analysis, candlestick patterns are considered as a representation of the market structure. They give a clear picture of price movement and how bulls and bears interact at any given time. Three inside up and three inside down candlestick pattern is a three candle trend reversal pattern. Three inside up candlestick patterns indicates a potential trend reversal found at the end of a downtrend.
The opposite is the Three inside down candlestick pattern. It indicates trend reversal at the end of an uptrend.
Three Inside Up Candlesticks Pattern
A Three Inside Up Candlesticks Pattern will signal when a downtrend is about to be reversed. As the name suggests, we have three candles to form the whole pattern.
The first one of the three inside up pattern is a long bearish candle, 2nd one followed by an inside bar, and finally the third one is a bullish candle that closes above the open of the first candle to complete the pattern.

The whole pattern signals how the power of control sifts from bears to bulls.
Rule of recognition
Here are the rules or conditions to be satisfied to consider the pattern as a three inside up candlestick pattern.
- Market is in a downtrend.
- First candle is a long bearish candle formed as a continuation of the downtrend.
- Second candle is an inside bullish candle closed around the midpoint of the 1st bearish candle.
- The third candle is a bullish candlestick that closes beyond the open of the 1st candlestick and obviously well above the close of the 2nd candle.
If the 2nd candle does not close around the midpoint of the 1st candle but the third candle still closes beyond the high of the 1st candle, it may be considered as a valid three inside up candlestick pattern.
Also Read: A Beginner’s guide to Technical Analysis for use in the stock market
Three inside down candlesticks pattern
Three inside down candlesticks patterns occur in a strong uptrend.
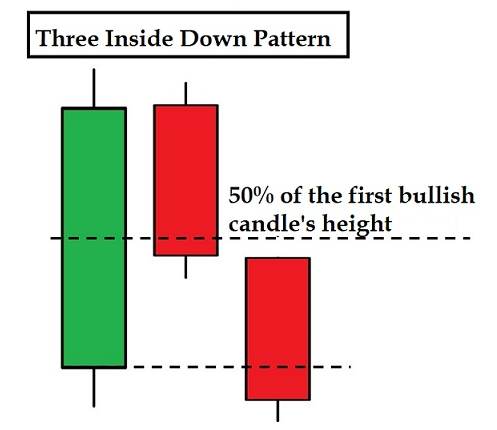
The first candle of the pattern is a long bullish candle as a continuation of the uptrend showing that the bulls are in full control for the time.
The second one in the pattern is an inside bearish candle. The open of the second candle is lower than the previous day’s close and the close is higher than the previous day’s open, this means the second candle’s trading range (both the wick and the body) is within the high and low range of the previous bullish candle.
The third candle which completes the pattern is a long bearish candle that actually violates the low of the first bullish candle. Few market participants consider it as three inside down pattern when the third candle starts trading below the close of the 1st bearish candle instead of waiting for the candle to close below the low of the 1st candle.
Rule of recognition
Here are the set of rules to get a confirmation that the pattern is the Three inside down candlestick pattern.
- There must be a continuation of an uptrend.
- The first candle formed must be bullish long candlestick indicating bulls are in control of the market.
- The second candle is a bearish closing near the midpoint of the 1st bullish candle.
- The third bearish candle opens near the close of the 2nd bearish candle but closes lower than the open of the 1st bullish candle.
Remember it’s not necessary that the 2nd candle must close around the midpoint of the 1st candle. However the third candle must close well below the 1st candle low to confirm the three inside down candlestick pattern formation.
Also Read: How to trade Three outside up/down candlestick pattern
Here is a list of candlestick patterns for your reference;
- Evening Star
- Morning Star
- Bearish Abandoned baby candlestick pattern
- Bullish Abandoned baby candlestick pattern
- Three outside up/down
- Inside Bar
- Bullish Piercing
- Dark Cloud Cover
- Spinning Top
- Shooting Star and Inverted Hammer
- Hammer & Hanging Man
- Gravestone, Dragonfly and long-legged Doji
- Engulfing Candlestick Pattern
- Spinning Top
- Marubozu
Be sure you practice identifying and trading these candlestick patterns on a demo account before trading them with real money.
In addition to the disclaimer below, please note, this article is not intended to provide investing or trading advice. Trading in the stock market and in other securities entails varying degrees of risk, and can result in loss of capital. Most investors and traders lose money. Readers seeking to engage in trading and/or investing should seek out extensive education on the topic and help of professionals.