Reversal price chart patterns allow you to spot trend reversals on a long or shorter timeframe. It allows you to take profit when the market is changing from bullish to bearish or bearish to bullish.
In our earlier article, we have discussed about classic continuation chart patterns that traders love to trade.
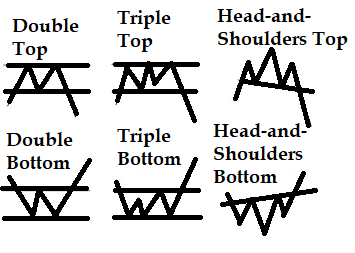
The double top and bottom, triple top and bottom, and the head and shoulders are known as trend reversal chart patterns.
The double-bottom chart pattern formation looks like the english letter “W”. You can see the pattern forming on daily or intraday time frames.
The opposite of the double-bottom is known as the double-top chart pattern. It’s shaped like the English letter “M”.
Double tops Chart Pattern
Double top occurs when price hits the same or similar high twice consecutively after a major uptrend.
Most importantly, the second top is considered as a failure while trying to break the first high. This failure may weaken the ongoing trend momentum.
Double bottoms Chart Pattern
Double bottom occurs when price hits the same or similar low price twice consecutively after a major downtrend. The second bottom is considered as a price failure to make a new low.
Traders may consider buying on a subsequent breakout above the highest point in the peak.
Know more about double tops and bottoms price patterns here.
Triple tops/bottoms Chart Pattern
Similar to double top, a triple top occurs when price hits the same or similar price high three times consecutively after a major uptrend.
A triple bottom occurs when price hits the same or similar low three times consecutively after a major downtrend. The second and third point is considered as failure in reaching a new low as a continuation of the downtrend.
Head and shoulders-Reliable reversal chart pattern
One of the most reliable reversal chart patterns is the head and shoulders.
When a head and shoulders price pattern forms at the top of an extended uptrend, it means a reversal to the down side.
Similarly, when an inverse head and shoulders price pattern formed at the bottom of an extended downtrend, it means price will reverse to the upside after breaking the neckline.
The primary difference between a triple tops and bottoms pattern and the head-and-shoulders pattern lies in the middle of the pattern. The middle peak in the head-and-shoulders pattern is higher than both left and right peak, which is not the case in triple tops/bottoms.
A head-and-shoulders pattern indicates repeated attempts to continue the trend but an ultimate failure after multiple tries.
When price breaks out of a pattern, the initial move is followed by a small corrective move against the direction of break, known as retracement move. Technical analysts consider it as a test of the break. They often wait for the retracement to take a trade when it’s over.
If a breakout can not hold, it means the signal is highly suspect. It indicates exhaustion, which means a strong price trend might move in the direction opposite to that indicated by the breakout.
Know more about head and shoulders patterns here.
Disclaimer: In addition to the disclaimer below, please note, this article is not intended to provide investing or trading advice. Trading in the stock market and in other securities entails varying degrees of risk, and can result in loss of capital. Most investors and traders lose money. Readers seeking to engage in trading and/or investing should seek out extensive education on the topic and help of professionals.