Candlestick patterns are used by market participants to know trend reversal. One of such reversal patterns is the morning star candlestick pattern. Traders closely watch for the formation of a morning star before taking any position.
Morning star is a three candlesticks major bottom reversal pattern printed in a downtrend market.
The first candle has a long bearish body. The second candle is a small real body that gaps lower than the first candle’s body. The third bullish candle’s body sometimes gaps higher than the second one but does not happen often.
The second day for the patterns start with a gap opening, indicating that the bears are continuing to push down the price, but bulls fight back to manage to close the day higher with a tight trading range closing below the first bearish candle.
The third candle opens up higher at or near the high of the second bar, bulls pushes the price up to close at or near the midpoint of the 1st bearish candle.
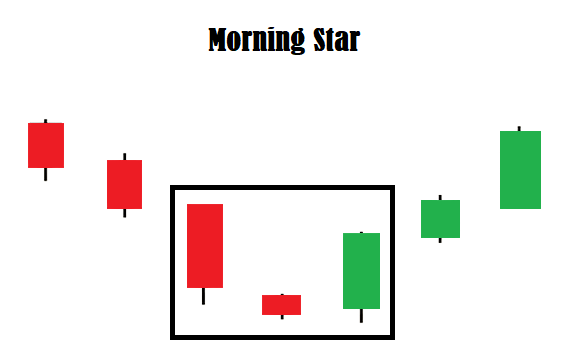
The middle candle can be red or green as the buyers and sellers start to balance out over the session.
Rules to recognition a Morning Star Candlestick Pattern
Here are the conditions to be satisfied to confirm morning star candlestick pattern;
- The market is in a downtrend.
- The first candle in the morning star candlestick pattern is a bearish candle which shows selling acceleration to the downtrend.
- The second candle shows dominance with a gap down opening but closed with a narrow range bar with bearish or bullish real body. The second candle shows the indecisiveness between bulls and bears. Color of the real body is not important as it shows indecisiveness.
- Third candle opens with a gap above the 2nd candle’s close and moves up to close between the midpoint and close of the 1st candle. If it closes above the close of the 1st candle, then it’s considered as more bullish.
Morning star is considered as a signal for the start of a bullish trend from the existing bearish down trend.
The expectation based on how the pattern is formed is that the bullishness is likely to continue over the next few candles to go long until another reversal pattern is formed.
Trading purely based on morning stars or any other candlestick pattern can be risky. It’s considered as best when backed by other technical indicators as confirmation of trend change.
In addition to the candlestick pattern formation, many traders prefer to read the confirmation by using different other technical indicators such as RSI, MACD, Stochastic, Support and Resistance levels, and volume.
Also Read: A beginner’s guide to technical analysis
In general high volume on the third candle is considered as a positive sign to go long.
Morning star is a trend reversal pattern. The exact opposite of the morning star is the evening star. Instead of a small trading range, if the second candle is a doji, then the pattern is referred to as a bullish doji star or bullish doji morning star. The Doji clearly shows the indecision among buyers and sellers.
Also Read: Understanding Basic Candlestick Charts
Here is a list of candlestick patterns for your reference;
- Evening Star
- Bearish Abandoned baby candlestick pattern
- Bullish Abandoned baby candlestick pattern
- Three Inside up/down
- Three outside up/down
- Inside Bar
- Bullish Piercing
- Dark Cloud Cover
- Spinning Top
- Shooting Star and Inverted Hammer
- Hammer & Hanging Man
- Gravestone, Dragonfly and long-legged Doji
- Engulfing Candlestick Pattern
- Spinning Top
- Marubozu
Be sure you practice identifying and trading these candlestick patterns on a demo account before trading them with real money.
In addition to the disclaimer below, please note, this article is not intended to provide investing or trading advice. Trading in the stock market and in other securities entails varying degrees of risk, and can result in loss of capital. Most investors and traders lose money. Readers seeking to engage in trading and/or investing should seek out extensive education on the topic and help of professionals.