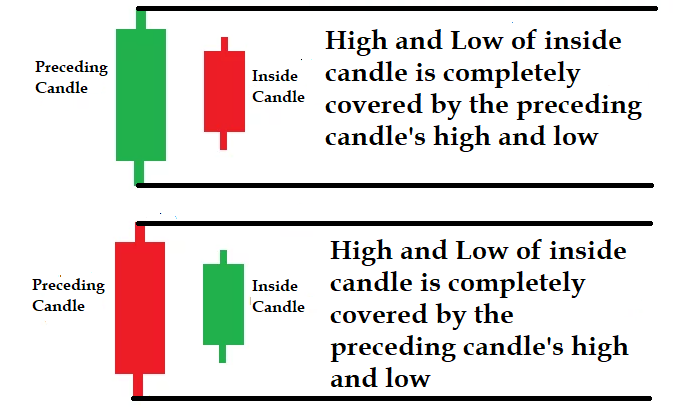
Inside candle is the opposite of a bullish or bearish engulfing pattern. In this type of pattern, the first candle completely engulfed the second candle. In other words, an inside candlestick pattern is formed when the high and low of the current candlestick falls within the boundaries of the prior candlestick high and low. It indicates little price movement relative to the previous candle.
The first candle of the two candlestick patterns is known as the Mother candle or Preceding candle, and the second candle is referred to as the Inside candle.
An inside candle is formed totally within the trading range of the preceding candle.
This type of two candles pattern indicates, there could either be a continuation or a reversal pattern.
An inside candle indicates that there was a closer fight between bulls and bears following a sharp up or down move in which either the bulls or bears have dominated.
Also Read: A Beginner’s guide to Technical Analysis for use in the stock market
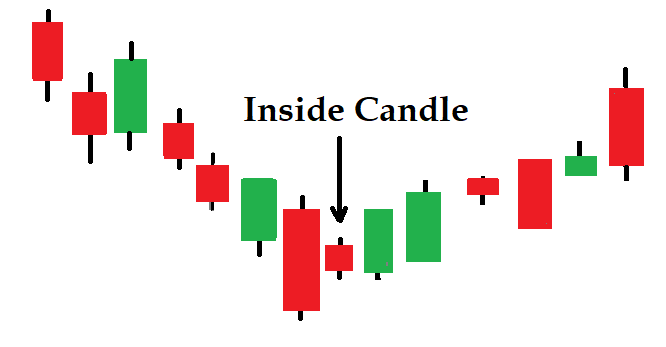
Most important thing is to know where exactly the inside candle is formed. If the inside candle is formed at a major support and resistance, then it can be considered as a reversal pattern. Whereas in a well established up or down trend, it can be a continuation pattern.
Bullish Inside Candle
The Bullish Inside candle is also referred to as the Bullish Harami candlestick pattern. Harami is the Japanese word for pregnant.
Bullish Harami Pattern have following features;
- Market is in an extreme downtrend.
- The first candle in the two-candlestick pattern is a bearish candle, reflecting continuation of bearish mood.
- Second candle gaps above the previous candle’s close on the opening, trades, and closes within the range of the first candle’s real body.
- Open of the bullish inside candle is higher than the close of the bearish candle. The low of the bearish candle is lower than the inside day candle low. The high of the bearish candle is higher than the high of the inside day.
- Bearish candle is longer than the bullish candle.

Bullish harami or inside candle is the opposite of the bullish engulfing pattern.
Instead of a bullish inside candle, you might get a doji. This type of pattern is referred to as “Bullish Harami Cross”.
Both bullish harami cross and inside day indicate trend reversal.
Bearish Inside Candle
Bearish inside candle or harami candlestick pattern can indicate reversal of an uptrend. Here are the features of the bearish harami candlestick pattern;
- Extreme uptrend must be in progress.
- The first bullish candle is a continuation of an uptrend.
- The next candle opens up lower than the close of the previous candle. Bears step in to push the price down but not lower than the open of the previous candle. This means on the signal day, price action does not stray outside of the previous candle high and low.
Instead of getting a bearish Inside candle, you may also get a doji. This type of pattern is referred to as bearish harami cross pattern.
A doji is a candlestick pattern that looks like a cross and usually indicates indecision in the market. Similar to the bearish inside candle, a bearish harami cross pattern also signals reversal.
Inside day candlestick pattern
In a daily chart, Inside candle is called Inside day.
This means Inside day is formed after the stock/security has experienced daily price ranges within the previous day’s high-low range. The stock/security has traded within the trading range of the previous day.
In other words, the price of the second trading day is completely contained within the range activity that was present during the first trading day.
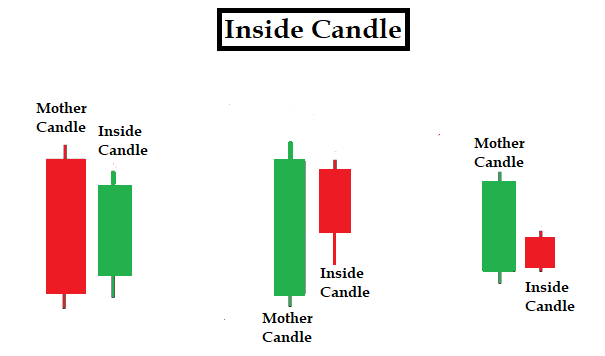
In the above picture you can see different variations of inside candle that can be seen in the market.
Inside day candlestick pattern indicates some consolidation and a possible breakout to either direction based on the market condition. Opposite of the inside candlestick pattern is the outside candlestick pattern or engulfing pattern.
How traders trade inside candle
Inside candle can be traded as a trade continuation or reversal based on where and how it’s formed.
In an uptrend if you find an inside bar, it means buyers are unable to push the price to a new high. Buyers are now losing some momentum. Sellers are also unable to take the price down below the previous candle’s low.
Therefore, the balance between both buyers and sellers are very close. When you find that neither the buyers nor the sellers are in control of the market, it means sentiment would be indecisive.
Inside candle in an uptrend indicates that the prevailing trend might change.
The smaller the real body of the inside candle relative to its predecessor, the more dramatic the change in the buyers or sellers balance, therefore the stronger the signal.
In case of extended uptrend, formation of Inside Candle indicates a pause in price movement. If traders get a breakout to the downside, they may consider to go short based on market sentiments.
Similarly in the case of extreme downtrend, if you get the Inside candle, then it signals a short term price reversal. If a breakout candle to the upside is formed, traders may consider going long for a short period of time.
Inside candle is not telling traders that the market will go higher or lower. It basically indicates the market has paused for a moment. Based on the type of breakout, traders consider going long or short.
Traders before taking any decision prefer to read the pattern of inside days with the help of other technical indicators such as Relative Strength Index (RSI), Stochastic, moving average convergence divergence (MACD), Support and Resistance to help predict whether the break is to the upside or downside.
Another most important characteristic to trade based on candlestick patterns is the time frame you use. Any time frame less than 15 minutes should be avoided if you are an intraday trader and want to trade purely based on the inside candle. Lower time frames are influenced by noise and might give you false signals.
Many conservative traders wait for double confirmation with the help of other technical indicators before taking a trade.
Like other candlestick patterns, Inside candle has very less significance in a choppy or sideways market. Traders prefer to trade with the trend when they see Inside candle setup.
If the price of the following candle takes over the high of the mother candle, then traders prefer to go long. Instead if it breaks downwards, then after the low has taken over, traders go short.
Conservative traders wait for the next candle to cross the high or low of the mother candle before taking a trade. Aggressive traders wait for the break of high or low of the inside candle before taking a trade.
Instead of a bearish inside candle on the signal day, if you get a doji, the pattern will be called a “bearish harami cross”. It can be interpreted in a similar manner as a Bearish Inside candle. A doji is a candlestick pattern that indicates some sort of indecision among buyers and sellers in the market.
We have written a different article on the Doji candlestick pattern, you can refer.
When this type of indecision candle appears in a strong down or up trend, it may signal that the trend is preparing to reverse.
Trading with technical tools like candlestick patterns is a highly specialized practice and it therefore must be done carefully. Be sure you practice identifying and trading these candlestick patterns on a demo account before trading them with real money.
Here is a list of candlestick patterns for your reference;
- Evening Star
- Morning Star
- Bearish Abandoned baby candlestick pattern
- Bullish Abandoned baby candlestick pattern
- Three Inside up/down
- Three outside up/down
- Bullish Piercing
- Dark Cloud Cover
- Spinning Top
- Shooting Star and Inverted Hammer
- Hammer & Hanging Man
- Gravestone, Dragonfly and long-legged Doji
- Engulfing Candlestick Pattern
- Spinning Top
- Marubozu
Be sure you practice identifying and trading these candlestick patterns on a demo account before trading them with real money.
In addition to the disclaimer below, please note, this article is not intended to provide investing or trading advice. Trading in the stock market and in other securities entails varying degrees of risk, and can result in loss of capital. Most investors and traders lose money. Readers seeking to engage in trading and/or investing should seek out extensive education on the topic and help of professionals.