Candlestick is simply a type of chart that is used by technical analysts to display open, close, high and low prices of a security. Its names such as it resembles an actual wax candle.
A single candle represents the market participant’s psychology for the session. Anyone can make a decision on whether to buy, hold or sell by investigating the relationship between one candle with the candles that preceded it. This means, anyone can understand how market participant’s psychology changes from the pattern that emerges.
We have three basic candle types:
- Bullish
- Bearish
- Indecisive

If you don’t know how a candle is formed, you are required to read our article “Understanding Basic Candlestick Charts” for further studies.
Bullish candlestick
A candle with a large body to the upside (i.e. closing price is greater than opening price) is referred to as bullish candlestick. It means the buyers are in control. If more buyers participate, they will keep pushing the price higher.
The relationship between the open and close is considered as vital information and forms the essence of candlestick formation.
If the close is greater than the open, it indicates buying pressure, which indicates the market is moving in an upward trend. In this type of situation you will get more bullish candles.
The bigger the body of the bullish candle, the bigger the upward price movement for that specific time period.
Bearish Candlestick
A candlesticks, where the close is less than the open, is referred to as bearish candlestick.
A bearish candlestick with a large body to the downside indicates selling pressure. It tells you that the sellers are in control of the price.
Bearish candlesticks indicate the market is moving in a downtrend.
Just by learning to read candlesticks, you will understand who is in control of a stock. This is an important skill to develop in day trading, it’s the study of mass psychology during the day by looking at how candles are formed.
The main focus should be who will end up in control. Whether the seller will lose control or buyers.
If buyers are in control, you want to be buying and holding. If sellers are in control, you want to be selling and selling short.
If you can’t recognize who is in control, let the bull and bear fight with each other and then enter the trade only when you are certain which side is likely to win. Try not to be on the wrong side of the trade.
Below image shows how different bullish, bearish and neutral candles are formed in candlestick charting.
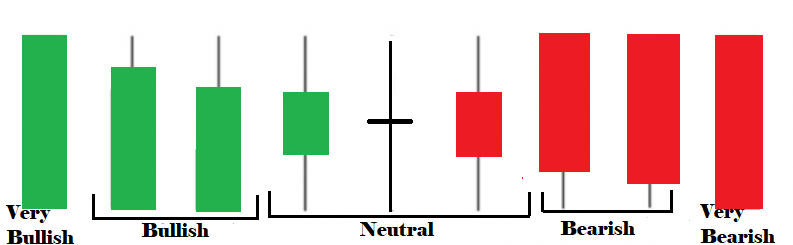
Marubozu candle is considered as extremly bullish and bearish candle for trading. In the above image exteme left and right candles are referred to as Marubozu or very bullish/bearish candle.
Indecisive candles
If the market is indecisive for a particular period, the candle shows an indecision pattern. This means neither the bulls nor bears are in control. This type of candlestick pattern is also referred to as DOJI or spinning tops.

Doji is a candlestick where the open and close are at the same or nearly the same price level. A Doji implies indecision and reflects a market where the bulls and bears are in equilibrium. A perfect Doji pattern has no red or green box. It’s printed like a cross shown in the middle of the above picture.
Not only the type of candles, patterns forming in combination of more than one candle is the most important criteria for trading decisions.
In pattern formation, size of the candle, where it forms, timing and color of the real body matters a lot. Therefore we should discuss why size, color and location of the pattern formation matters in candlestick charting.
Why size, location and color matters in candlestick charting
To interpret the psychology of the market participants, you need to look for the following three elements in a candlestick:
- Size
- Location of the pattern formation
- Color of the body
A large size candle indicates tremendous strength and power behind the move. Location of the candle will indicate whether the long candle is developing a continuous or reversal pattern.
To understand who controls the market, based on how the candle opens and closes, colors are printed automatically by the charting software.
A bullish candle is printed in green color to indicate that the bulls are in control. A bearish candle is printed in red color to indicate that the bears are in control.
Instead of green and red to indicate bullishness and bearishness, many market participants use white and black respectively. Anyone can change the color of the candle in charting software they use based on his/her liking.
The only category of the candle where color is not printed is where there is indecision among buyers and sellers, this type of candles are called Doji.
Let us understand how candles are interpreted based on size and color.
Long green and red candle
Long green and red candles are the one where the open and close are far apart. This means the body of the candle has a greater than average price range.
A long green candle is considered very bullish, as throughout the session, buyers have full control. Similarly a long red candle indicates that the session is very bearish and the bears have full control.
You need to pay attention to the length of the candle while trading. The length of the candle signifies the range within which buyers and sellers agreed to trade.
If you are looking at a daily chart, then the length of the candle tells you the trading range of the day. In general, the longer the candle, the more intense is the buying or selling activity. Likewise, if the candle is short, you can conclude that the trading action was subdued for the session.
If the real body of the green candle is greater than the body of average preceding candles and it has no or very small wick on both sides of the body, it’s considered as extremely bullish.
Instead of a green candle, if it’s a red candle, it’s considered extremely bearish. These types of candles are called “Marubozu”.

A simple long bullish candle will have its upper and lower shadows. The body size represents the degree to which the bulls overcome the bears or the bears overcome the bulls. A large body shows increased commitment.
Short candle
Short or small candle is the one where the trading range is small, this means the difference between open and close is small. This type of candles reflect narrow price movement. Like we discussed in our earlier paragraph, size of the body shows the level of commitment. Therefore, a small real body shows reduced commitment.
In general, these candles are considered insignificant. However, based on its location in price action and in relation to the previous candles, traders may consider it as the most significant candle.
Few example of significant short candles are;
If the candle has no body or is created when its opening price and closing price are the same, it’s called Doji.
The upper and lower shadow can be long or short. It is classified as a neutral candle to indicate that neither buyer or seller has control.
When you find a Doji with an upper shadow and no lower shadow, it’s called gravestone Doji, which indicates bearishness. If the Doji has lower shadow and no upper shadow, it’s called Dragonfly Doji, which indicates bullishness.
Another important property of candlestick is its range. The range of the candle is the distance from the high to the low. It shows the level of volatility of the price for the session. A wide range shows increased volatility and a narrow range shows reduced volatility.
Remember, drawing a candle or candlestick pattern requires a close, therefore, wait for the close to complete the pattern or candle. Don’t jump in to trade by assuming a pattern is forming.
Combination of different types of candles, location and timing matters the most in taking a trading decision. All these combinations are known as candlestick patterns.
Here are the most important candlestick patterns we have covered for your further studies;
- Evening Star
- Morning Star
- Bearish Abandoned baby candlestick pattern
- Bullish Abandoned baby candlestick pattern
- Three Inside up/down
- Three outside up/down
- Inside Bar
- Bullish Piercing
- Dark Cloud Cover
- Spinning Top
- Shooting Star and Inverted Hammer
- Hammer & Hanging Man
- Gravestone, Dragonfly and long-legged Doji
- Engulfing Candlestick Pattern
- Spinning Top
- Marubozu
These candlestick patterns are considered as the most important reversal signal in an up/down trend. Traders closely monitor these pattern formation in combination with other technical indicators to take a trading decision.
By seeing a particular candlestick pattern formation in your chart, you should not enter a trade.
Overall market sentiment is the most important factor than the candle pattern formation. For instance, if there is some market news (like Balakot airstrike, Coronavirus disease (COVID-19), Indo-China border tension, Russia-Ukraine war, and other major news break from regulators) during or after market hours which can cause sudden panic among market participants, you should take extra precaution in analyzing the pattern with respect to the overall market sentiment.
Be sure you practice identifying and trading these candlestick patterns on a demo account before trading them with real money.
In addition to the disclaimer below, please note, this article is not intended to provide investing or trading advice. Trading in the stock market and in other securities entails varying degrees of risk, and can result in loss of capital. Most investors and traders lose money. Readers seeking to engage in trading and/or investing should seek out extensive education on the topic and help of professionals.