In technical analysis, candlestick patterns are a representation of the market structure. They give a clear picture of price movement and how bulls and bears interact at any given time. In this article, we will be discussing an important japanese candlestick pattern called bullish abandoned baby.
Abandoned baby gets its name from the second candle of the pattern which looks like floating on the chart by itself like it’s been abandoned by the first and third candle. This abandoned candle should be small in size compared to the first and the third one in the pattern.
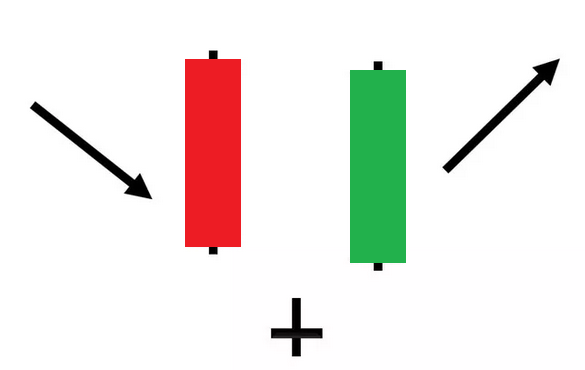
We have two types of abandoned baby candlestick pattern;
- Bullish abandoned baby candlestick pattern, and
- Bearish abandoned baby candlestick pattern
Bullish abandoned baby candlestick pattern
In candlestick charting, Bullish abandoned baby pattern is used by traders to signal a reversal of a downtrend. It is composed of three candles. The first is a bearish candle showing continuation of the existing downtrend, followed by a doji candle that gaps down below the first bearish candle, and the third candle is a bullish candle which opens higher than the close of the 2nd doji candle and moves aggressively up to close higher.
Rule of recognition
Here are the conditions to be satisfied;
- First bar is a bearish candle closing at its low as a continuation of the bearish trend.
- Second bar gaps down, traded low and then pushed back by bulls to close at or near the open with a tight trading range forming a doji type of candle. The high of the second candle, referred to as abandoned baby, nevel goes higher than the low of the first bearish candle, leaving a gap between both the first and second candle.
- The third candle gaps up opening higher than the abandoned candle, bulls pushes the price higher to close the bar at or near the first bearish candle’s close.
Above conditions must be satisfied for the pattern to form.
Psychology behind bullish abandoned baby candlestick pattern
The formation of the Bullish abandoned baby shows that selling has been at least temporarily exhausted and it’s a start of a price moving higher.
The first candle of the bullish abandoned baby pattern shows that the sellers are participating in the existing downtrend due to which price has been dropping aggressively.
The price in the next candle gaps down and closes with a tight range by forming a Doji candle, which shows that selling is leveling off as the open and close prices are nearly the same, in other words buyers are stepping in and sellers are losing momentum.
When the third candle gaps higher than the doji, it clearly shows that buyers have taken control of the market and selling has at least temporarily exhausted.
Counter trend traders always look for these types of patterns to trade against the trend to have an early entry to a major up move.
With an expectation that the price will move higher, some traders prefer to enter on the break of the third bullish bar of the pattern. Aggressive traders prefer to enter on the third bar itself with a tight stop loss to have an early entry to the trend.
Abandoned baby pattern is very rare to see as price movements need to meet certain specific criteria for pattern formation. You can see these types of patterns when selling exhausted in a downtrend.
The opposite of the Bullish abandoned baby is known as the Bearish abandoned baby pattern, which signals the possible end of an uptrend.
Both the bullish and bearish abandoned baby candlestick patterns are similar to the evening star and morning star formation.
The difference that makes the abandoned baby pattern different from evening and morning star patterns is the formation of the doji candle with a gap on either side. The evening and morning star patterns do not require the middle candle to be a doji as shown in the bullish and bearish abandoned baby pattern.
Here is a list of candlestick patterns for your reference;
- Evening Star
- Morning Star
- Bearish Abandoned baby candlestick pattern
- Three Inside up/down
- Three outside up/down
- Inside Bar
- Bullish Piercing
- Dark Cloud Cover
- Spinning Top
- Shooting Star and Inverted Hammer
- Hammer & Hanging Man
- Gravestone, Dragonfly and long-legged Doji
- Engulfing Candlestick Pattern
- Spinning Top
- Marubozu
Be sure you practice identifying and trading these candlestick patterns on a demo account before trading them with real money.
In addition to the disclaimer below, please note, this article is not intended to provide investing or trading advice. Trading in the stock market and in other securities entails varying degrees of risk, and can result in loss of capital. Most investors and traders lose money. Readers seeking to engage in trading and/or investing should seek out extensive education on the topic and help of professionals.